About us
RESULTS & STATUS
The results of current testing are contained primarily on four reports that are all accessible under the menu bar at the top under “Y Reports.”
R1b-S1051 Project Reports
Detailed report of all Y STR values for every member in the projected sorted by project subgroup. Check this report for project administrator recommendations on STR and SNP testing. The report comes in multiple pages so as not to be slow, but you can view all of the pages at once if you enter 1000 into “page size.” If you are looking for a particular name or kit number you can do a “Ctrl-F” or “Find” from your internet browser. Many members use the Y Classic Chart to copy/paste (special) data from so they can do their own analyses. Please read the “Analysis and Commentary” (scroll down) for information on the subgroups.
Detailed report of all Y STR values for every member in the projected sorted by project subgroup. This report has statistics for each STR for each subgroup. This is includes the mode (most common), the minimum and the maximum values. Genetic genealogists often use the modal value as a proxy for the ancestral value for a subclade. This is not always true, but it is oftentimes very helpful to look for an a pattern of unusual values within a clade or subclade. This is called an STR signature and if you can identify a group that you fit into with a shared STR signature that can help your SNP testing be more efficient as the signature may indicate an underlying SNP marked subclade.
Detailed report of all actual SNP test results for every member in the project. This report is very useful if you can determine a valid STR signature from the reports mentioned above. If you have other project members that you have close Genetic Distances (on your myFTDNA Y matches webpage) or you have members that match your STR signature you can search through this SNP report and see if your matches have tested for certain SNPs and see what their results are.
Global map that will show you the distribution of various project subgroups. You select which subgroup you want to view. You can use this to get an idea of where certain subgroups might be from. Be cautious, though, a point of origin is not necessarily the point with a high frequency of a particular subgroups. Many researchers think higher STR diversity and the presence of brother subclades is more indicative of origins.
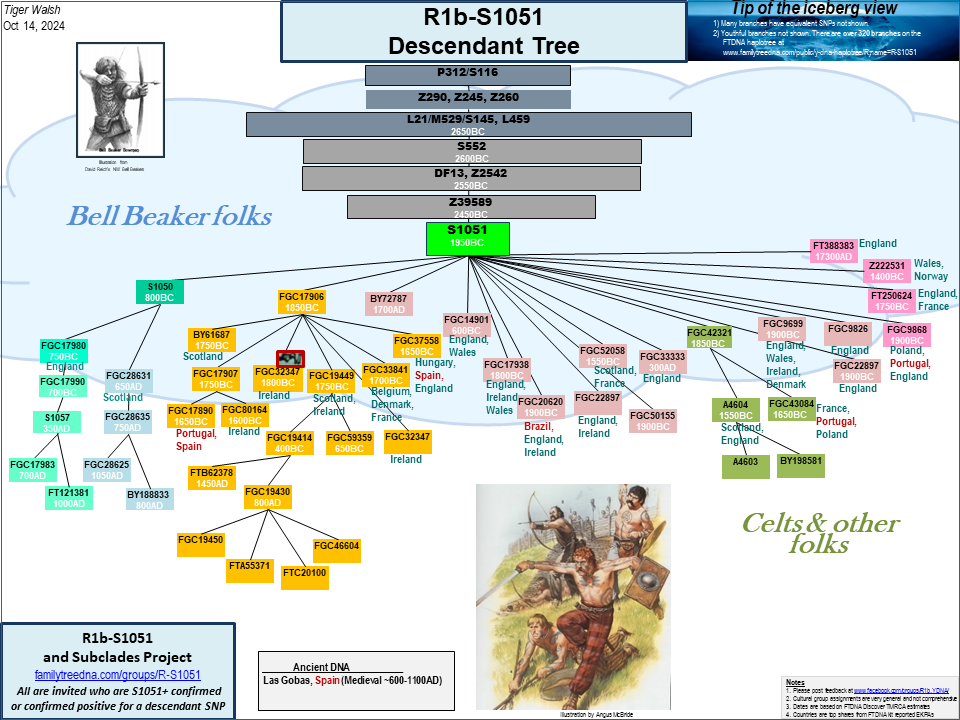
R1b-S1051 Descendant Tree
An overview of the early and major branches.
PDF downloadable version of the Tip of the Iceberg Descendant Tree. This file has more resolution for better visibility with zooming and panning.
Downloadable PDF file
R-S1051 FTDNA haplotree